Mushroom Workshop
Categorical representation · clustering · association rules
Objective
This workshop asks how unsupervised techniques can represent, partition and explain a categorical mushroom dataset. One-Hot Encoding makes the categories usable by common algorithms, but produces a sparse, high-dimensional space in which distance, density and two-dimensional visualisations must be interpreted carefully.
The class label is withheld from clustering and used only afterwards to measure agreement with the known edible/poisonous partition. It is also used as a consequent during the separate association-rule stage.
Dataset
| Item | Executed notebook result |
|---|---|
| Observations | 8,124 |
| Original columns | 23: one class and 22 categorical predictors |
| Predictors after constant-column removal | 21 |
| One-Hot encoded features | 115 |
Unknown stalk-root entries imputed |
2,480 |
| Reference classes | Edible and poisonous |
The "?" values in stalk-root are treated as missing and imputed with the
mode, category b. The constant veil-type column is removed before the class
column is separated and the remaining predictors are One-Hot encoded.
flowchart LR
    A[Categorical data] --> B[Clean and encode]
    B --> C[Reduce dimensions]
    C --> D[Cluster]
    D --> E[Evaluate]
    E --> F[Mine rules]
    F --> G[Interpret]
Representation and dimensionality reduction
The baseline notebook uses PCA to reduce the 115 encoded indicators to ten
components for clustering and t-SNE for exploratory visualisation. The advanced
extension uses a two-dimensional UMAP embedding with random_state=42 to
preserve local neighbourhood structure for visual inspection.
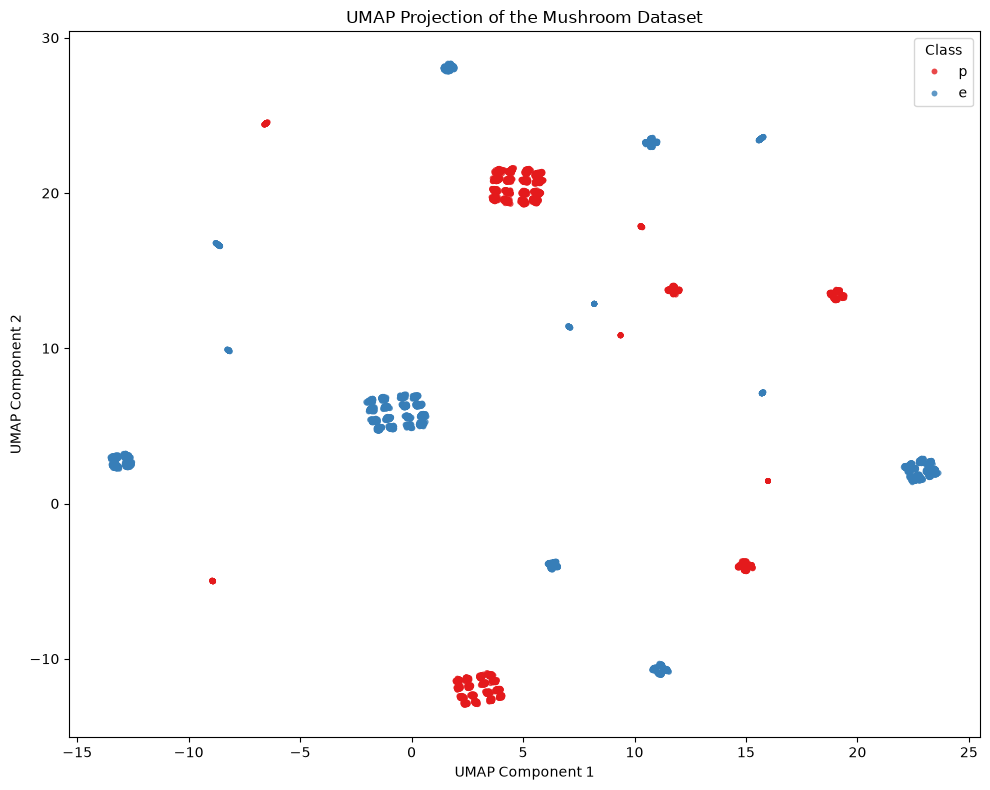
Figure 1. UMAP projection of all 8,124 observations. Reference classes colour the points only after the unsupervised embedding is fitted.
The compact islands show local organisation in the representation. They do not prove that a clustering algorithm will reproduce the two reference classes: UMAP compresses 115 dimensions into two and prioritises neighbourhoods rather than class separation.
Clustering
Baseline progression
The ten-component PCA representation supports a two-cluster K-Means solution with retrospective ARI 0.6171 and NMI 0.5663. Agglomerative clustering produces a similar result (ARI 0.6090, NMI 0.5936). DBSCAN finds several groups, but its agreement changes with the distance definition: ARI 0.3736 with Euclidean distance and 0.3236 with Jaccard distance.
These results established that representation and metric choices materially change the partition, motivating the advanced UMAP and HDBSCAN experiments.
K-Means on UMAP
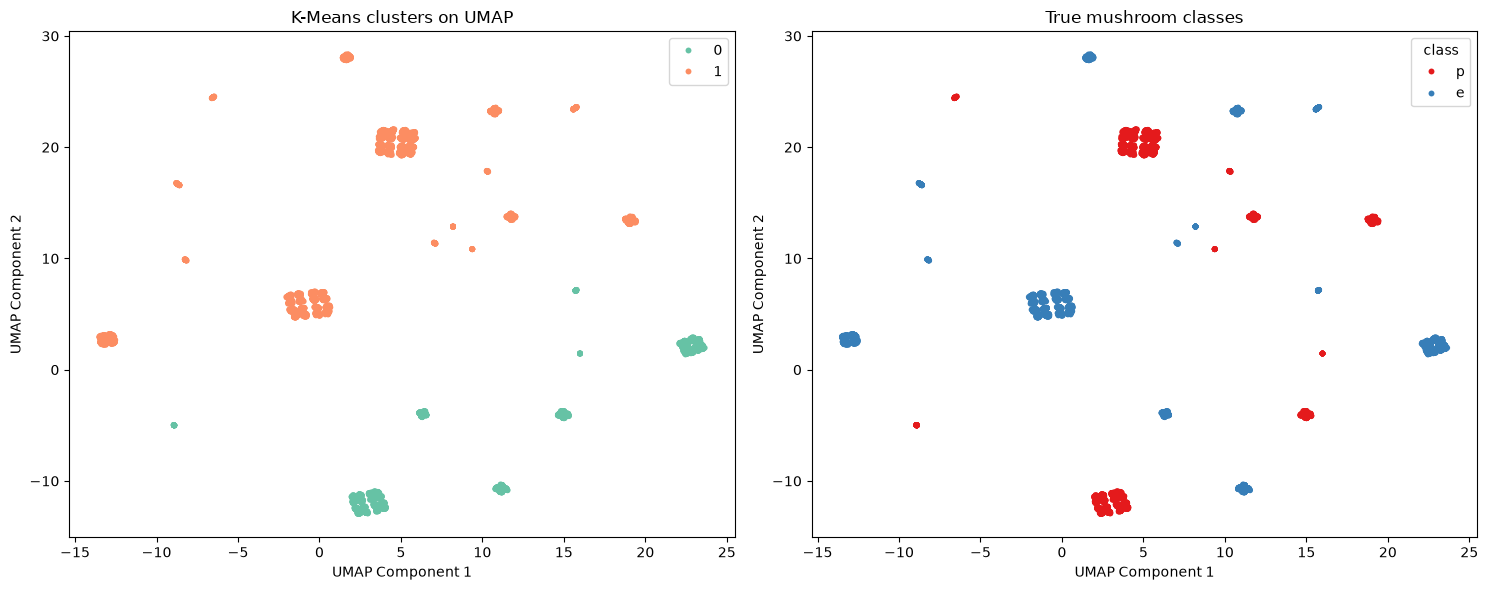
Figure 2. Two K-Means clusters on the UMAP embedding (left) and the withheld reference classes (right).
K-Means on the two-dimensional UMAP coordinates records ARI 0.0116 and NMI 0.0079. The weak agreement is a useful negative result: visually distinct UMAP islands do not combine into the same two groups as the human-defined class label.
HDBSCAN density structure
The baseline HDBSCAN configuration (min_cluster_size=30) identifies 92
clusters and 24 noise observations. Rather than forcing a binary split, it
captures many small density regions in the UMAP geometry.
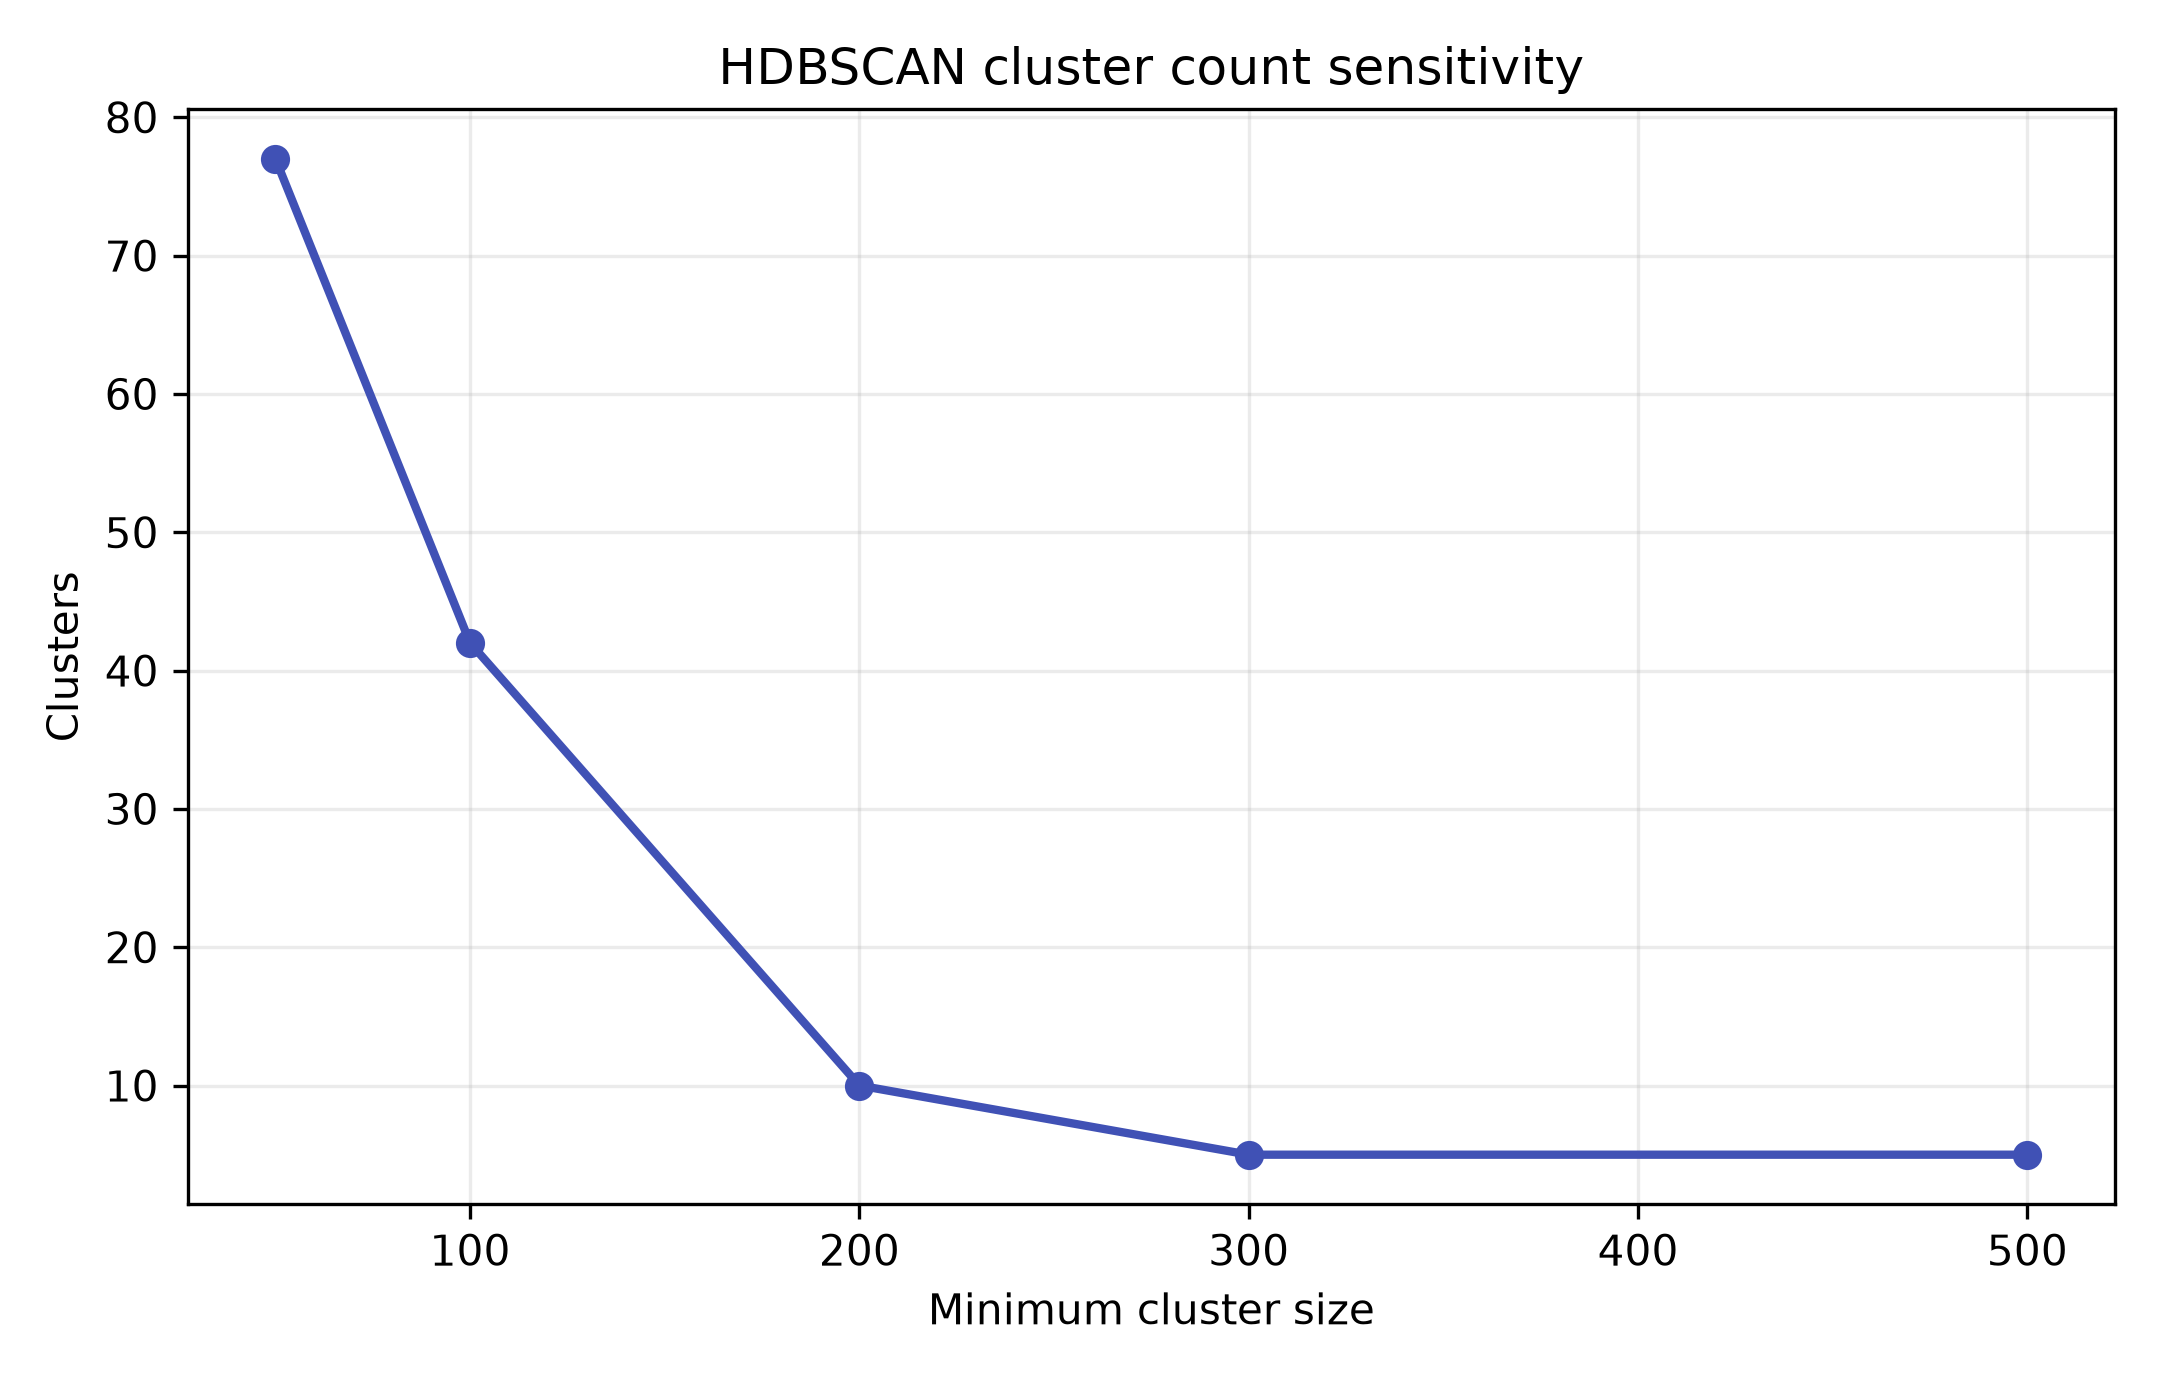
Figure 3. Detected cluster count as `min_cluster_size` increases from 50 to 500.
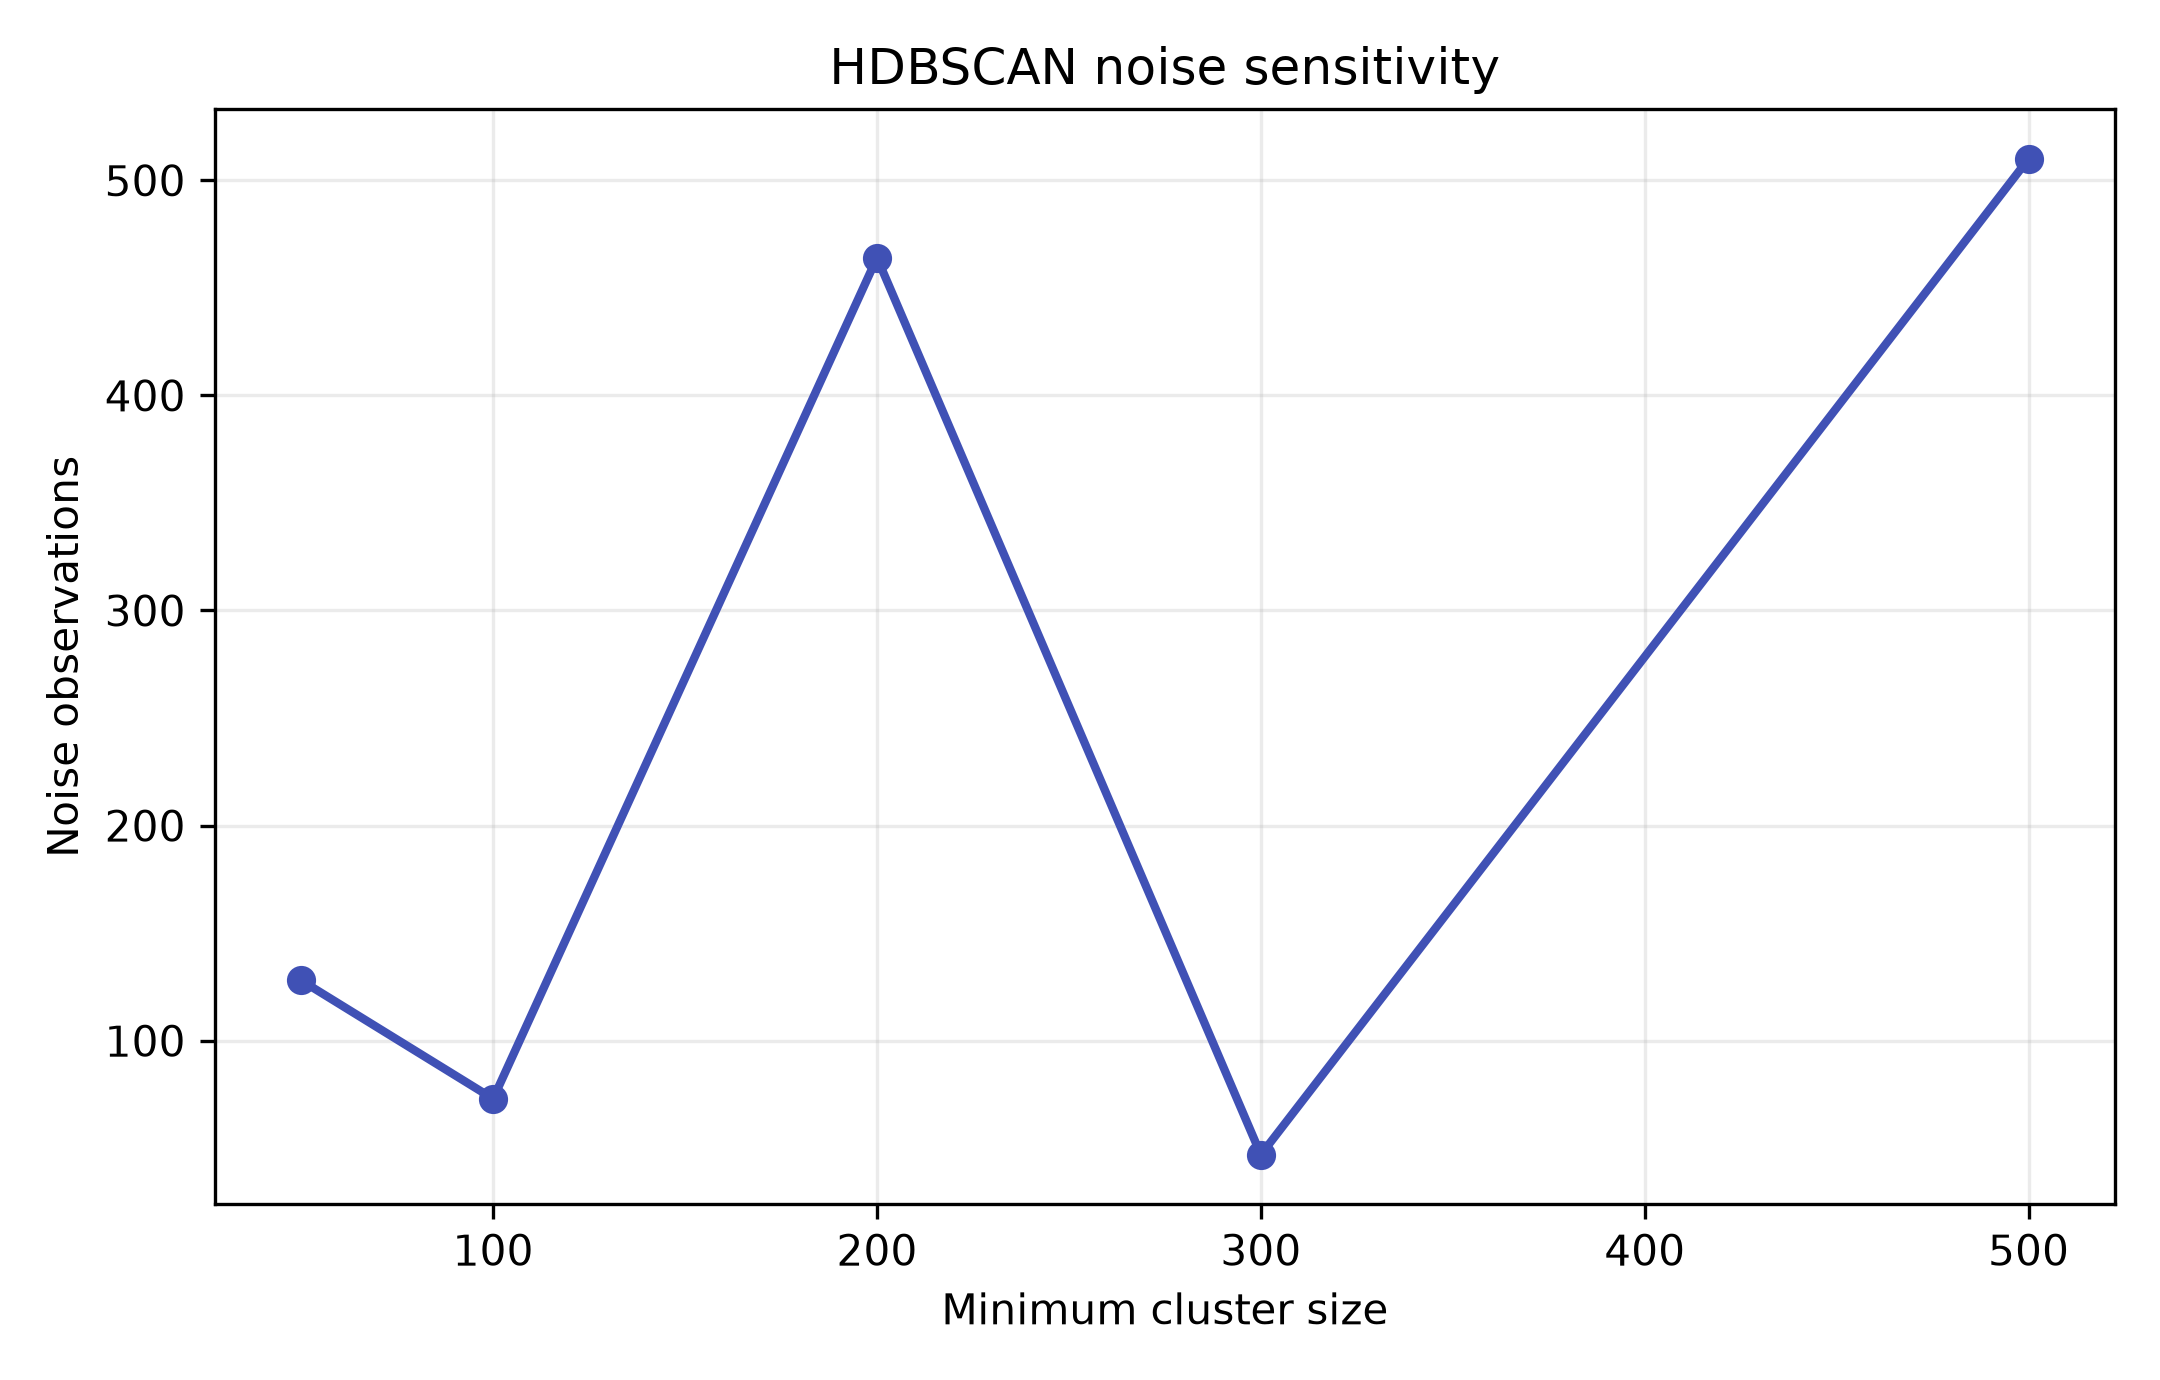
Figure 4. Noise assignments for the same parameter sweep.
The cluster count falls from 77 to 5 across the tested settings, while noise changes non-monotonically from 47 to 510 observations. This sensitivity means the density partition is exploratory rather than a fixed answer.
Algorithm comparison
| Representation and algorithm | Clusters | ARI | NMI | What it shows |
|---|---|---|---|---|
| PCA(10) + K-Means | 2 | 0.6171 | 0.5663 | Strongest ARI in the baseline comparison |
| PCA(10) + agglomerative | 2 | 0.6090 | 0.5936 | Similar partition, slightly higher NMI |
| One-Hot + DBSCAN, Euclidean | 6 | 0.3736 | — | Multiple distance-defined groups |
| One-Hot + DBSCAN, Jaccard | 11 | 0.3236 | — | Partition changes with categorical distance |
| UMAP(2) + K-Means | 2 | 0.0116 | 0.0079 | Visual structure does not reproduce the labels |
| UMAP(2) + HDBSCAN | 92 + noise | — | — | Granular, parameter-sensitive density structure |
ARI and NMI compare clusters with labels retrospectively; they are not inputs to model fitting. The table also compares different representations, so it explains the evolution of the workshop rather than declaring a universal winner.
Association rules
Association rules are particularly useful here because they translate encoded categories back into readable combinations. FP-Growth retains itemsets with support at least 0.20, and rules are generated with confidence at least 0.90.
- Support describes how often a combination occurs.
- Confidence describes how often its consequent occurs when the antecedent is present.
- Lift compares that confidence with the consequent's base rate.
The executed workflow generates 3,462,243 rules. After filtering to class-predicting rules, 7,028 predict edible and 4,128 predict poisonous. The compact selected rules have confidence 1.00 and lift 1.930608 for edible or 2.074566 for poisonous consequents.
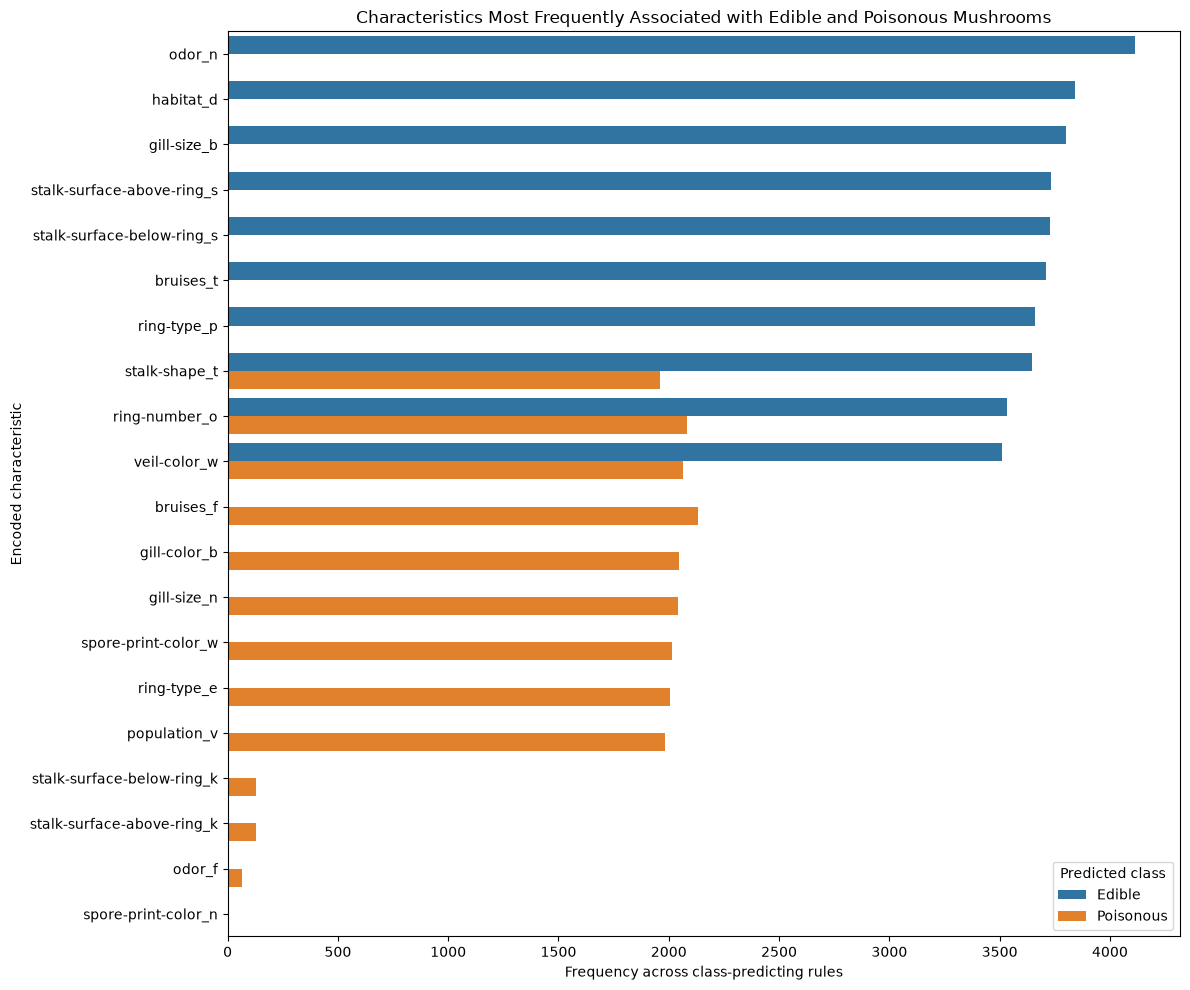
Figure 5. Characteristic frequencies across the class-predicting rule sets.
odor_n appears in 4,112 edible-predicting rules and none of the
poisonous-predicting rules in this output. Other characteristics occur on both
sides, demonstrating why frequency alone is not a sufficient discriminator.
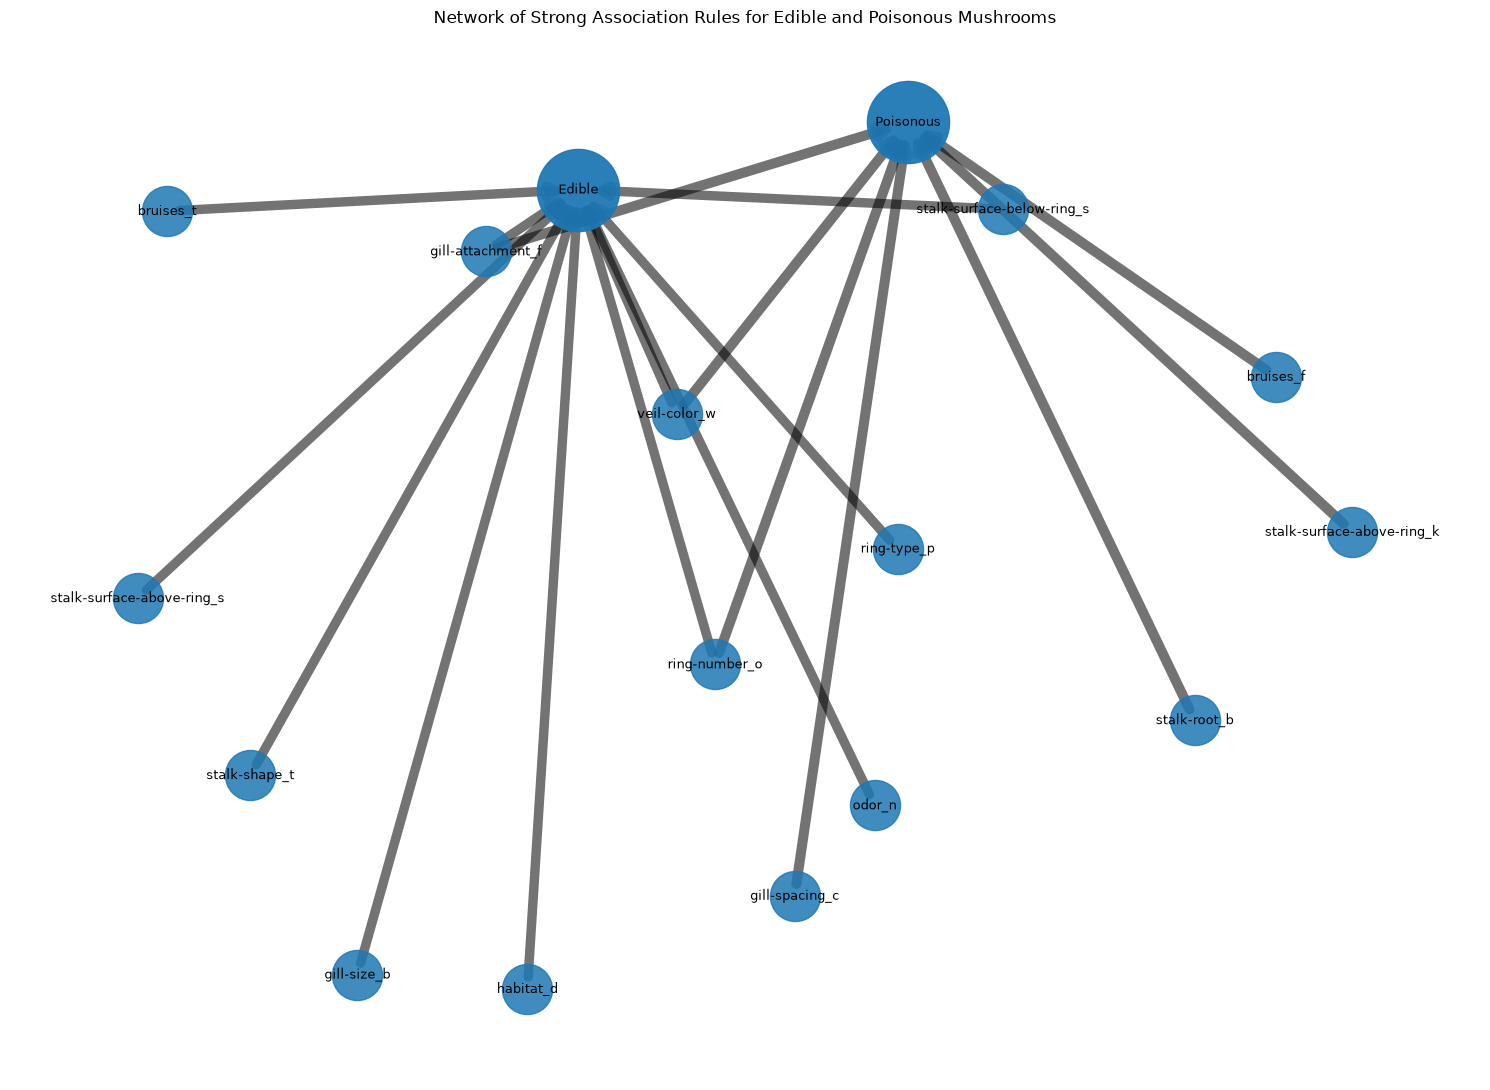
Figure 6. A compact network from encoded characteristics to class consequents for ten selected rules per class; edge width follows lift.
The network makes overlapping combinations visible, but it is a co-occurrence view—not a causal graph or identification guide.
Advanced extension
The advanced notebook extends the baseline in three directions:
- UMAP tests whether a nonlinear representation exposes local structure.
- HDBSCAN explores that structure without fixing the number of clusters.
- FP-Growth and association rules turn categorical co-occurrence into inspectable statements.
Together, the results show that geometry, partitions and readable rules answer different questions. The most visually organised representation was not the one with the strongest label agreement, while rule mining supplied the clearest feature-level interpretation.
Key findings
- Ten-component PCA with K-Means or agglomerative clustering produced moderate retrospective agreement with the two reference classes.
- UMAP revealed compact local regions, but K-Means on that embedding agreed weakly with the labels.
- HDBSCAN exposed granular density structure whose cluster and noise counts depended strongly on its parameters.
- Association rules were the most directly interpretable output, although the very large rule set required filtering and careful reading.
Limitations
Safety notice
These results describe statistical associations in a curated dataset. They must not be used to identify mushrooms or decide whether a real mushroom is safe to consume.
- Two-dimensional PCA, t-SNE and UMAP views necessarily discard information.
- UMAP and HDBSCAN results depend on representation, environment and parameter choices despite fixed random states where applicable.
- One-Hot categories can be mutually exclusive or strongly correlated, and rule confidence does not imply causality.
- The findings have not been validated on an independent mushroom dataset.
Conclusions
The workshop demonstrates that categorical unsupervised learning is primarily a representation problem. PCA-based clustering recovered part of the known binary structure, UMAP/HDBSCAN revealed finer local geometry, and association rules produced the most readable combinations. None of these outputs is a single ground truth: each reflects a different analytical objective and must be interpreted with its assumptions visible.
The full evidence is reproducible in
workshop-clustering-Mushrooms.ipynb
and
workshop-advanced-unsupervised.ipynb.